Daily-Average And Cumulative Figures Do Not Share A Table
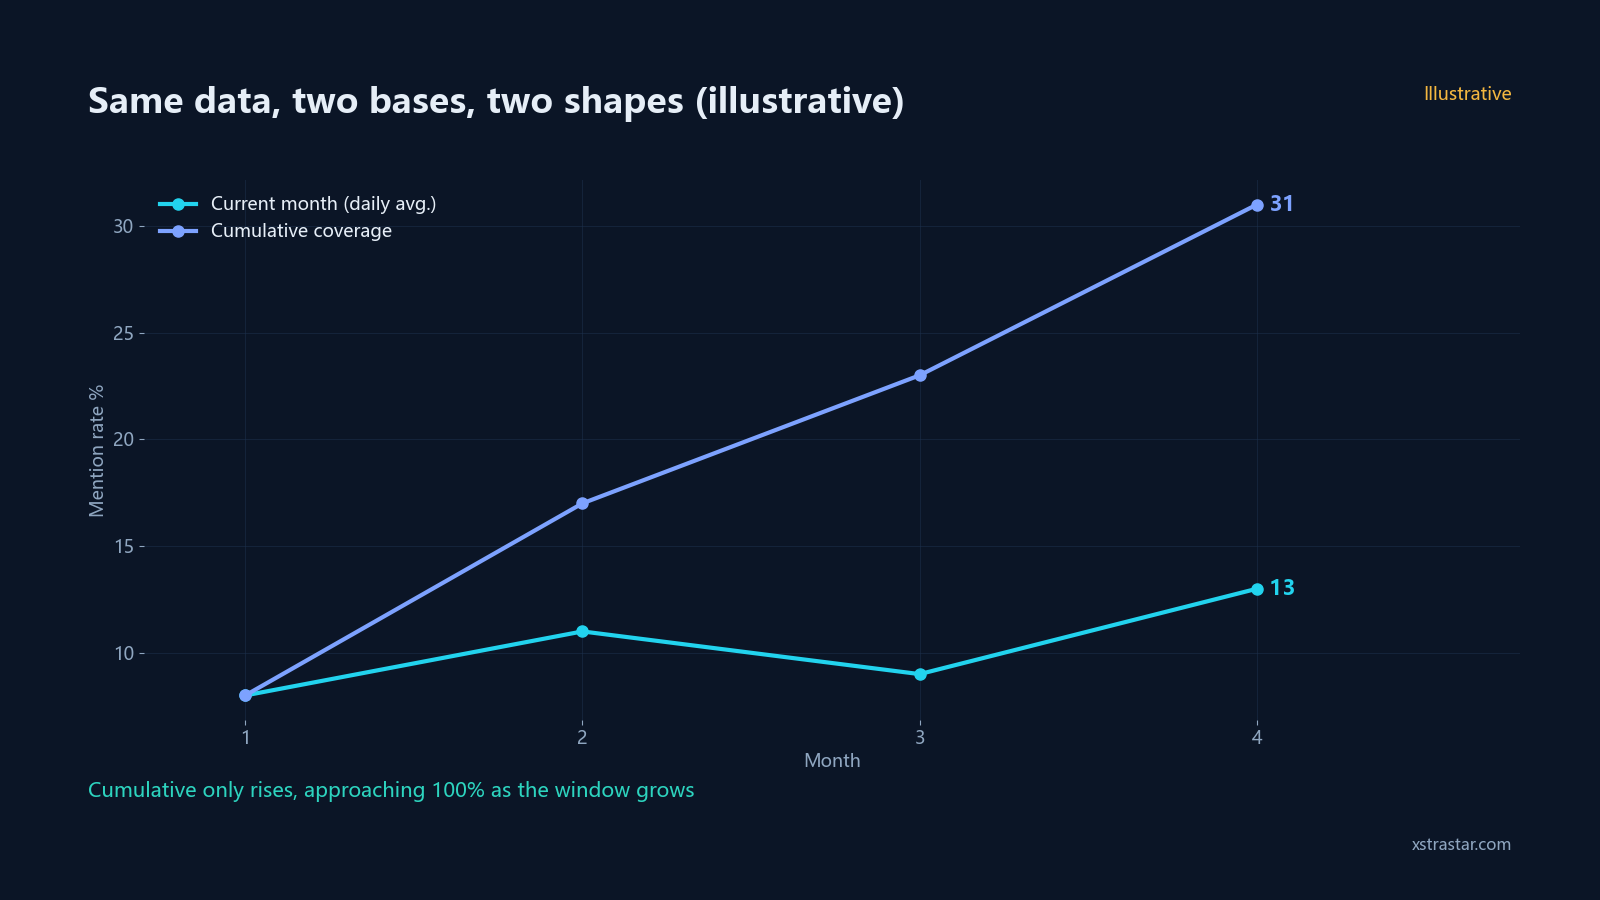
The same metric returns very different values under the two bases, and a cumulative figure rises mechanically as the window grows.

XstraStar Editorial Team
GEO Research & Strategy

In this article
The same metric returns very different values under the two bases, and a cumulative figure rises mechanically as the window grows. Mixed into one table, readers add a monthly value to a cumulative one and land on a number that is neither.
Three rules cover it: label the basis in the header, use one basis per metric, and give every addend its own cumulative column whenever a cumulative total appears.
How far apart the two run
Take a question set with monthly mention rates of 8%, 11%, 9% and 13% across four months (an illustrative set, not measured data).
| Basis | Calculation | Value at month 4 |
|---|---|---|
| Daily average (current month) | Answers containing the brand that month ÷ samples that month | 13% |
| Cumulative coverage | Questions where the brand appeared at least once in four months ÷ total questions | Well above 13%, and only ever rising |
Cumulative coverage never falls. Longer windows push it toward 100%, every vendor in a category converges there, and the metric stops discriminating. Useful internally for trend, unsuitable for published figures or acceptance clauses.
The three rules
Rule 1: label the basis in the header. Monthly columns carry "/ month" or "current month". Cumulative columns carry "cumulative". Without those words, no reader can tell which is which.
Rule 2: one basis per metric, matching the footnote. A footnote reading "cumulative from month 1, baseline excluded" alongside columns that add the starting stock every month contradicts itself, and any reader who recomputes gets a different answer.
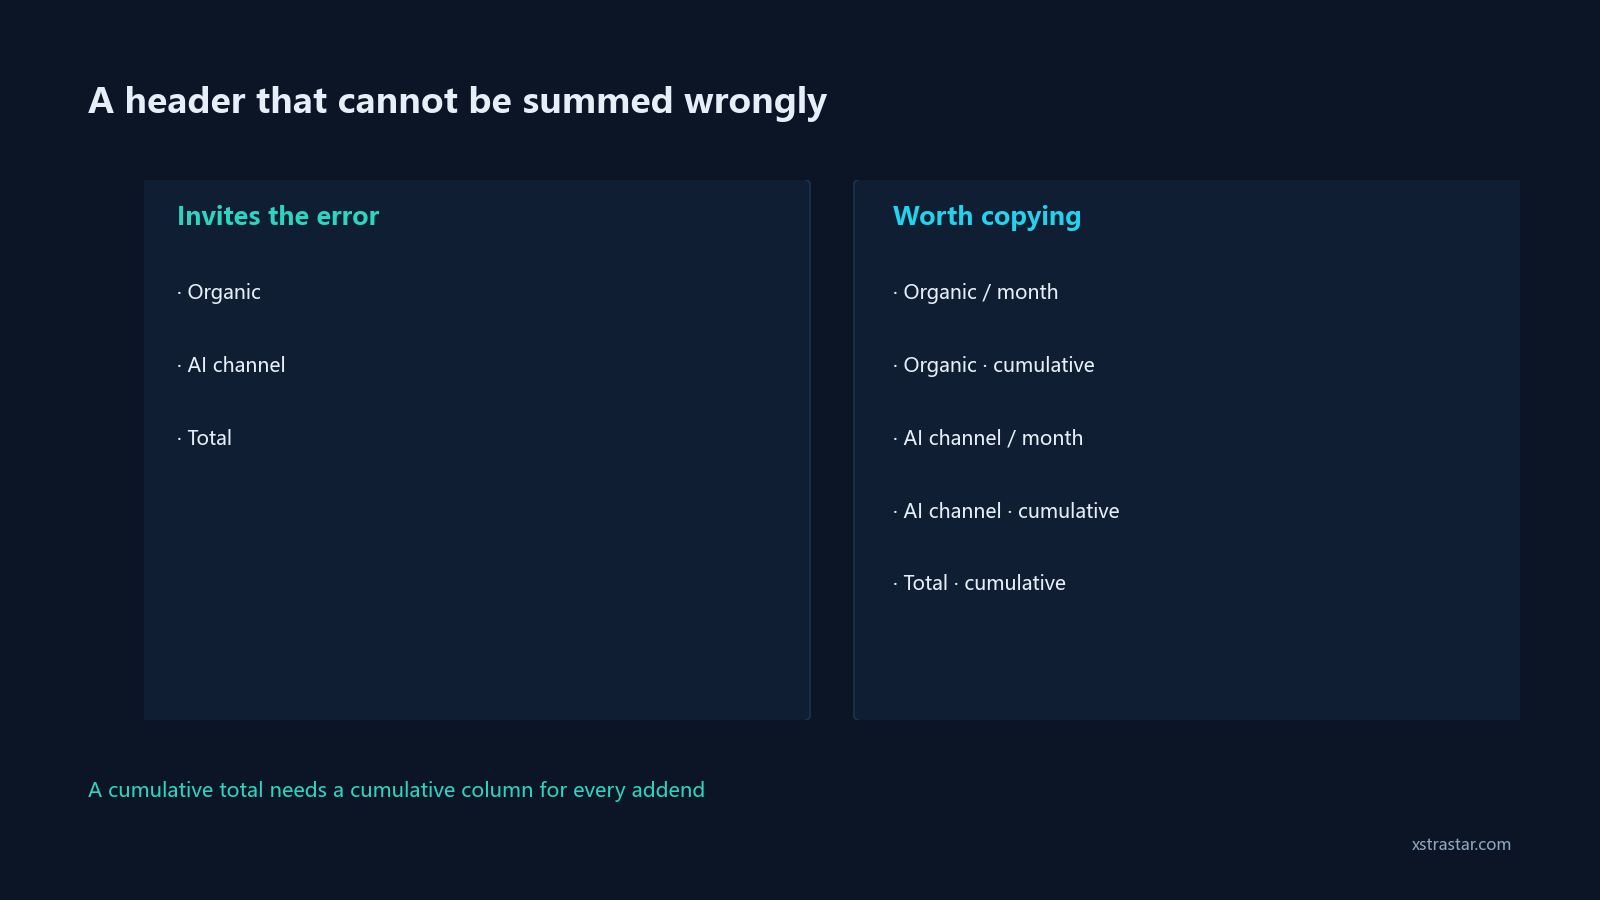
Rule 3: whenever a cumulative total appears, every addend needs its own cumulative column. Missing one column guarantees that readers add the two numbers in front of them. The shape of the error, in constructed form: a table shows "organic · cumulative" and "AI channel / month", a reader sums those two as a total, and the correct addend was "AI channel · cumulative", which the table omitted. The gap equals every earlier month of the AI channel. Size of the numbers changes nothing; the missing column is the whole error.
A header worth copying
| Month | Organic / month | Organic · cumulative | AI channel / month | AI channel · cumulative | Total · cumulative |
|---|---|---|---|---|---|
| M1 | … | … | … | … | … |
| M2 | … | … | … | … | … |
Four conventions travel with it:
- State the first month of accumulation in the header or immediately beside it (for example, "cumulative from M1, M0 baseline excluded").
- Keep the baseline month on its own row, never folded into cumulative.
- Mark missing months as "not collected", never as 0.
- Check the bottom of the page once columns multiply: a squeezed table pushes the footnote off the sheet, and the footnote is where the basis lives.
The same trap in ranking data
"Pages currently inside the top 10" is a state; "pages that have ever been inside the top 10" is cumulative. A third-party per-keyword export (2026-06, United States, one leading site in this category, 4,074 non-branded keywords) shows 0.1 monthly clicks per keyword at positions 11–20, which means pages that once reached the top 10 and later dropped out contribute nothing to current traffic. Report current effect from current state.
⚠️ A frequent companion error: charting both bases on one axis. The cumulative line always climbs while the monthly line moves both ways, and one shared axis reads as continuous growth. Use stacked panels with separate baselines.
Key takeaway: A metric's daily-average and cumulative values differ sharply, and cumulative figures only rise, trending toward 100% as the window grows, which suits internal trend reading and not published figures or acceptance clauses. Three rules: label the basis in every header ("/ month" against "cumulative"), keep one basis per metric consistent with the footnote, and give every addend its own cumulative column whenever a cumulative total appears, since readers otherwise sum a cumulative value with a monthly one and miss every earlier month of the second series. Conventions: state the first month of accumulation, keep the baseline row separate, mark uncollected months as gaps instead of zeros, and check that footnotes survive once columns multiply. Never chart both bases on one axis.
Related: Measurement discipline | Mention rate | How to measure GEO | Position bands decide priority
Sources: Position bands and click distribution from a third-party keyword tool export (2026-06, United States, one leading site in the category, 4,074 non-branded keywords); estimates. Reporting rules from XstraStar reporting practice; the mention-rate series and the addition example are constructed illustrations, not measured values.
Last updated: 2026-08-27
Turn insight into growth
Find your next AI search growth opportunity
From brand visibility and citation sources to content strategy, the XstraStar team will help you map a clear, measurable GEO optimization path.
Talk to a GEO advisorAbout the author
XstraStar Editorial Team
GEO Research & Strategy
The XstraStar editorial team studies AI search, generative engine optimization, and brand visibility, turning platform mechanics, field experience, and market shifts into practical growth guidance.
Related insights